My Self-Hosted AI Stack: Architecture Overview (Part 1)
I’ve been building out my self-hosted AI stack over the past eighteen months. It’s been quite a journey for me personally and I have learnt a huge amount. Everything runs on my own hardware. All the containers sit behind Traefik, with public access done via Cloudflare Tunnels. The containers are orchestrated with Docker Compose driven by Portainer. The intention is to have no SaaS subscriptions, no data leaving the house unless I explicitly choose it. I have previously written about the underlying Infrastructure. This post goes into the AI stack itself. I will Also publish added a sanitised version of my Docker Compose and Ansible playbook to allow you to get up and running. I have previously spoken around this journey at VMUG. Although I haven’t fully moved away from commercial hosted AI tools I have significantly reduced their usage.
Table of Contents
Prerequisites
Before deploying the stack, you need the following in place. I’m listing everything here because getting these right upfront saves a lot of debugging later. I have talked about what is needed and automating these prerequisites here
If you have followed along you should already have an Ubuntu VM with a GPU and drivers passed into it and then Docker, Docker Compose and the Docker Container toolkit already configured. You will also have a Traefik load balancer setup ready to go.
For the next steps you will also need some SMB storage for some of the container configuration files.
DNS Records
The stack exposes 12 services via Traefik, each on its own subdomain of your base DOMAIN. You can either create individual A/AAAA records or a single wildcard record (*.$DOMAIN) pointing to your Traefik host. If you’re using Cloudflare Tunnels for public access, each subdomain needs a corresponding tunnel route.
| Subdomain | Service | Purpose |
|---|---|---|
chat | Open WebUI | Primary chat interface |
ollama | Ollama | LLM API (basic auth protected) |
comfyui | ComfyUI | Image generation UI |
whishper | Whishper | Speech-to-text UI |
terminal | Open Terminal | Browser shell (API key protected) |
smarterrouter | SmarterRouter | Intelligent model routing API |
searxng | SearxNG | Private metasearch engine |
n8n | n8n | Workflow automation |
langfuse | Langfuse | LLM observability dashboard |
jaeger | Jaeger | Distributed tracing UI |
prometheus | Prometheus | Metrics collection |
grafana | Grafana | Dashboards and visualisation |
Network & Storage
The only inbound ports required at the host level are 443 (HTTPS) and optionally 80 (for HTTP→HTTPS redirect) — Traefik handles everything else. All inter-service communication happens on the internal Docker bridge network with no host port bindings. If you’re using NAS-backed storage for Prometheus and Jaeger data, the Docker host needs SMB/CIFS access to the share on port 445. Without a NAS, you can swap the CIFS volume definitions in observability.yml for standard local Docker volumes — you just lose the ability to survive a host failure without data loss on those services.
The Big Picture
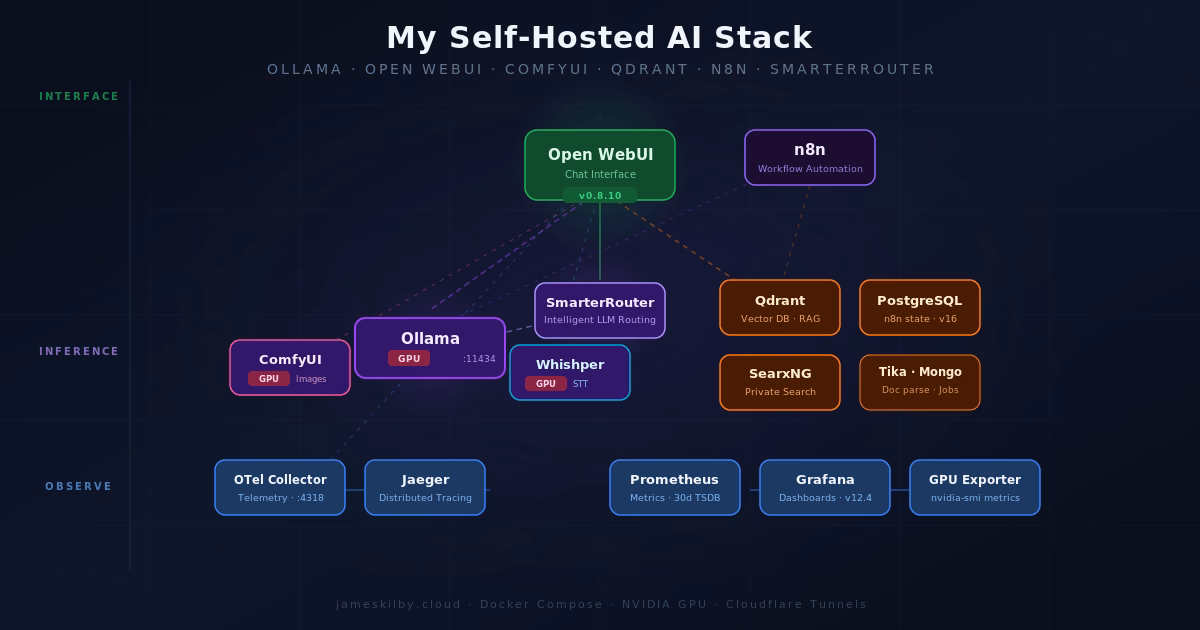
The stack breaks down into seven architectural layers: inference (GPU model serving), interface (user-facing UIs), routing (intelligent model selection), data (databases and search), langfuse (LLM-specific observability), observability (tracing and metrics), and automation (workflow orchestration). Each layer lives in its own compose file and is merged by a thin orchestrator using Docker Compose include (v2.20+). Every service runs in its own container with resource limits and health checks, and Traefik handles TLS termination and routing for everything that needs to be internally and externally accessible.
The orchestrator itself is deliberately minimal — it’s just an include block with comments explaining the dependency order:
include:
  # Foundation layers (no cross-layer deps)
  - path: compose/inference.yml
  - path: compose/data.yml
  - path: compose/observability.yml

  # Depends on data + observability
  - path: compose/langfuse.yml

  # Depends on inference
  - path: compose/routing.yml

  # Depends on inference + data + observability + langfuse
  - path: compose/interface.yml

  # Depends on inference + data
- path: compose/automation.ymlThis means I can work on the observability layer without scrolling past 200 lines of inference config, and each file manages its own volumes and network attachments. The no-gpu.yml override slots in alongside these to strip NVIDIA device reservations for CPU-only hosts.

Inference Layer
Ollama
Ollama is the heart of the operation. It runs a variety of large language models (LLMs) downloaded locally. It exposes these as a REST API that’s OpenAI-compatible. Using my NVIDIA A10 with 24GB of vRAM available I can have multiple smaller models loaded simultaneously, or a single larger model.
ComfyUI
ComfyUI handles image generation. It’s a node-based interface for building diffusion pipelines, and it integrates into Open WebUI so image generation happens inline in the chat interface. Like Ollama, it gets NVIDIA GPU access — though the two services have to share the GPU, so the resource limits matter here. ComfyUI gets up to 12GB of RAM and 6 CPU cores.
Interface Layer
Open WebUI
Open WebUI is the primary chat interface. It talks to Ollama as its backend, with the OpenAI-compatible API used for model interactions. It’s configured to use Qdrant as its vector store (for RAG), Apache Tika for document parsing, SearxNG for web search augmentation, Whishper for speech-to-text, and ComfyUI for image generation. That’s a lot of integrations wired up, and it all just works once the service names resolve correctly inside the Docker network.
One thing I’ve added that I’m particularly happy with is the Open Terminal integration — this gives Open WebUI a shell execution capability, so models can run commands and return results. It runs as a separate container (open-terminal:0.11.23) exposed at terminal.$DOMAIN via Traefik, with API key authentication gating access. The container is sandboxed on the internal network, but opens up genuinely useful agentic workflows — models can inspect logs, query databases, or run scripts without needing direct host access.
An Open WebUI Backup sidecar runs alongside the main container, performing sqlite3 .backup every six hours to a SMB-mounted volume. It is configured to retain the last seven database snapshots and the last four upload archives. This exists because SQLite does not work reliably over SMB (file-locking issues), so the main data stays on a fast local Docker volume while crash-consistent copies are pushed to network storage for durability.
OpenTelemetry is also enabled on Open WebUI, which pipes traces to the OTel Collector and on to Jaeger. A separate Pipelines container handles deeper LLM-layer tracing via the Langfuse filter pipeline — covered in more detail in my next post.
Whishper
Whishper is a self-hosted Whisper transcription service with a web UI. It exposes an OpenAI-compatible API endpoint, which is what Open WebUI uses for its speech-to-text input. Models are loaded on-demand from a mounted volume, and the service gets GPU access for faster transcription. Backed by MongoDB for job storage.
Open WebUI Pipelines
Open WebUI Pipelines is a plugin framework that sits between Open WebUI and its LLM backends, intercepting every request and response. It runs as a separate container exposing an OpenAI-compatible API on port 9099, and Open WebUI connects to it as a second backend endpoint alongside Ollama.
The reason it’s in the stack is the Langfuse filter pipeline. Rather than manually installing pipelines through the Admin UI, the container auto-downloads the pipeline script on startup via the PIPELINES_URLS environment variable — so the Langfuse integration is live the moment the container is healthy, with no manual steps required. The pipeline is pre-configured with the Langfuse API keys and internal host, so traces start flowing immediately.
This gives Langfuse richer data than the native OpenTelemetry tracing alone — the filter pipeline captures the full request/response cycle at the application layer, including prompt content, response text, token counts, and latency per turn, which OTel traces don’t expose at that level of detail. The two approaches complement each other: OTel covers infrastructure and service-level tracing, Pipelines covers the conversational layer.
Routing Layer

SmarterRouter
SmarterRouter is a recent addition to my stack. It sits in front of Ollama and acts as an intelligent LLM router — instead of hardcoding which model to use for a given request, SmarterRouter analyses the prompt and selects the most appropriate model dynamically. I believe this capability is really important in constrained environments — users either choose a tiny model for a quick response and risk being disappointed by the results, or a much larger model that can be slow to load and respond. It does this by profiling all of the AI models available in Ollama. This is done on SmarterRouter startup. It connects to Ollama, lists the available models and then profiles them. This can take some time on initial launch but it’s a one-time operation unless new models are added. SmarterRouter regularly polls Ollama, so if a new model is added this is handled automatically.
This can be seen in the logs where I added a new model in Ollama it auto detected and started profiling.
INFO - Found 14 existing profiles, profiling 1 new models
INFO - PROGRESS [1/1] Starting profiling: deepseek-r1:8b
INFO - Warming up model deepseek-r1:8b (size=4.9GB, timeout=130s)
INFO - Loading model: deepseek-r1:8b (keep_alive=300, timeout=None)
INFO - Adaptive timeout calculated: 334s (floor=99s, method_a=334s, method_b=74s, token_rate=48.5 tok/s)
INFO - PROGRESS [1/1] deepseek-r1:8b - reasoning (1/5) - 6.7% - ETA: 22m 56s remaining
INFO - PROGRESS [1/1] deepseek-r1:8b - reasoning (2/5) - 13.3% - ETA: 11m 28s remaining
INFO - PROGRESS [1/1] deepseek-r1:8b - reasoning (3/5) - 20.0% - ETA: 7m 38s remaining
INFO - PROGRESS [1/1] deepseek-r1:8b - coding (1/5) - 40.0% - ETA: 3m 49s remaining
INFO - PROGRESS [1/1] deepseek-r1:8b - coding (2/5) - 46.7% - ETA: 3m 16s remaining
INFO - PROGRESS [1/1] deepseek-r1:8b - coding (3/5) - 53.3% - ETA: 2m 52s remaining
INFO - PROGRESS [1/1] deepseek-r1:8b - creativity (1/5) - 73.3% - ETA: 2m 5s remaining
INFO - PROGRESS [1/1] deepseek-r1:8b - creativity (2/5) - 80.0% - ETA: 1m 54s remaining
INFO - PROGRESS [1/1] deepseek-r1:8b - creativity (3/5) - 86.7% - ETA: 1m 45s remainingIt works with any OpenAI-compatible client, so a wide range of tools can connect to it. The routing logic is informed by benchmarks pulled from HuggingFace and LMSYS, and it builds per-model profiles by running a set of sample prompts at startup. It’s configured to prefer smaller and newer models where they’re capable enough, which helps keep latency down on simpler tasks.
A few features worth calling out from the config:
- VRAM-aware routing — it monitors GPU VRAM and can automatically unload models using an LRU strategy when memory gets tight, then load the right model for the next request.
- Response caching — a 500-entry cache with a 1-hour TTL avoids redundant inference on repeated or similar prompts.
- Signature injection — responses are annotated with the model that actually handled them (
Model: {model}), which is useful for debugging and understanding routing decisions. - SQLite-backed routing state — profiles and cache persist across restarts in a named volume.
- Automated backups for PostgreSQL — the Open WebUI backup sidecar pattern works well and I’d like to extend it to pg_dump snapshots for the Langfuse, n8n, and Grafana databases.
- LiteLLM as a unified gateway to front both local Ollama models and external APIs (OpenAI, Anthropic) behind a single endpoint, with spend tracking and per-user rate limits.
The practical result is that you can send any prompt to a single endpoint and let the router decide whether it warrants a heavyweight model or whether something smaller and faster will do. For a homelab running a single GPU, this kind of intelligent load management makes a real difference.
Help me study vocabulary: write a sentence for me to fill in the blank, and I'll try to pick the correct option.

smarterrouter/main
 Here's a vocabulary sentence for you:
The politician's speech was full of _______ statements that sounded impressive but actually said very little of substance.
Choose the best option:
A) eloquent B) mundane C) grandiose D) candid
What's your answer? Model: qwen3-coder:30b
Data & Automation Layer
Qdrant
Qdrant is the vector database. It stores embeddings for Open WebUI’s RAG pipeline — when you upload a document or paste text into a chat session, it gets chunked, embedded, and stored in Qdrant. At query time, relevant chunks are retrieved and injected into the context window. It’s fast, well-documented, and runs comfortably in a container.
Apache Tika
Apache Tika is the document parsing layer. When you feed Open WebUI a PDF, Word document, or spreadsheet, Tika extracts the text so it can be embedded and stored in Qdrant. It handles an enormous range of file formats and runs as a simple HTTP service.
SearxNG
SearxNG is a self-hosted, privacy-respecting meta-search engine. Open WebUI is configured to use it for web-augmented queries — when a model needs to search the web, it fires queries at SearxNG rather than a third-party search API. This keeps search queries off external platforms and gives me control over which search backends are aggregated.
n8n
n8n is the workflow automation layer. It has native Ollama integration, so it can call local models as part of automated workflows. Combined with its broad library of integrations (webhooks, APIs, databases, and more), this is where AI capabilities get wired into actual processes. n8n uses PostgreSQL for its persistent store, which runs in the same internal Docker network.
Observability Layer
This is the part most self-hosted AI setups skip, and I think it’s worth talking about separately.
OpenTelemetry Collector + Jaeger
Open WebUI emits OTLP traces, which are collected by the OpenTelemetry Collector and forwarded to Jaeger for storage and visualisation. This means I can trace individual requests through the system — from the user message, through model inference, RAG lookups, and tool calls. When something is slow or broken, the trace tells me exactly where.
The Collector also acts as a security boundary. A filter processor strips sensitive attributes — passwords, tokens, authorisation headers, and API keys — from traces before they reach Jaeger. This means I can enable verbose tracing on services without worrying about credentials leaking into the trace store. The Collector also enriches every span with environment and cluster resource attributes, and enforces a memory limiter (512 MB cap with 128 MB spike headroom) to prevent runaway cardinality from taking down the pipeline.
Prometheus + Grafana + NVIDIA GPU Exporter
Prometheus scrapes metrics from services. Grafana visualises them. The NVIDIA GPU Exporter surfaces per-GPU metrics (utilisation, memory, temperature, power draw) via nvidia-smi, which Prometheus scrapes and Grafana displays. Watching GPU utilisation during inference makes it much easier to tune OLLAMA_NUM_GPU and memory limits.
Grafana’s provisioning is fully automated — datasources (Prometheus and Jaeger with trace-to-metrics correlation) and dashboards are loaded from config files on startup. A custom AI Stack Overview dashboard is included in the repo and deployed by the Ansible playbook, giving an out-of-the-box view of GPU utilisation, model load times, inference latency, and service health without needing to build anything manually after deployment.
Alongside the generic GPU exporter, a custom Ollama Prometheus Exporter polls the Ollama API (/api/tags and /api/ps) and exposes model-level metrics — available model counts, currently loaded models, and per-model VRAM consumption. This gives Grafana dashboards visibility into which models are resident in GPU memory at any given time, which is essential for debugging slow first-token latency when a model needs to be loaded from disk.
Langfuse
Langfuse is LLM-specific observability — purpose-built for tracking prompts, model usage, latency, and evaluation in a way that generic APM tools don’t address. While Jaeger gives me distributed traces and Prometheus gives me infrastructure metrics, Langfuse fills the gap at the AI application layer: which prompts are slow, which models are being used, how responses score on quality, and where tokens are being spent.
The stack behind it is more substantial than you might expect. ClickHouse handles trace storage — it’s a columnar analytics database well-suited to the high-volume, time-series nature of LLM traces. Redis manages job queues between the web UI and the background worker. And MinIO provides S3-compatible object storage for raw event uploads before they’re processed into ClickHouse, keeping ingestion fast and durable under load. A small minio-init container handles bucket creation on first run.
The two Langfuse containers — langfuse-web (UI and API, at langfuse.jameskilby.cloud) and langfuse-worker (background processing) — share the same ClickHouse, Redis, and MinIO backends, with PostgreSQL handling relational metadata. Both containers wait for healthy ClickHouse, Redis, and MinIO before starting, which keeps startup ordering clean. Telemetry back to Langfuse HQ is disabled.
Langfuse is also configured with bootstrap variables that automatically create the initial organisation, project, and admin user on first start. The public and secret API keys are set via environment variables and match what the Pipelines filter uses to authenticate — so the full Langfuse integration is functional the moment the stack comes up, with no manual setup through the UI required.
Continue Reading
This post is Part 1 of a multi-part series. The architecture overview above covers what each layer does and why it’s there. The next two parts will go deeper into the infrastructure and operational side.